Learn how to navigate the Analytics tab in the Administrator Portal and view analytics about collections, classes, and users
Within this article:
• Overview
• Analytics Descriptions
1. On the Analytics page, you can view data regarding licenses, usage, interactivity, and more!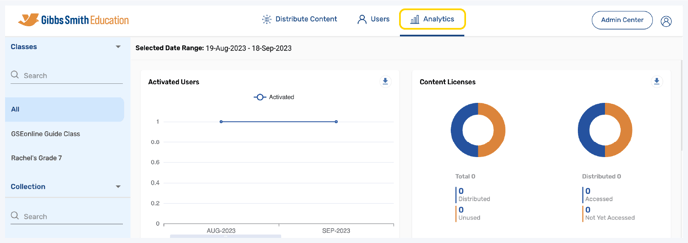
2. (District Accounts Only) Click the School Selection from the top of the page and select which school you would like to display analytics for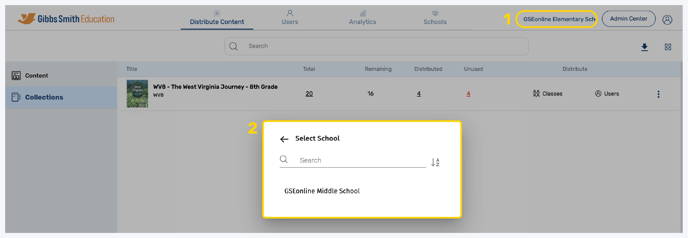
3. The default date range for analytics is the past month
Tip: To select a custom data range click the dates, make a selection, and click OK

4. The default analytics display is all collections, classes, and users
Tip: Select a class from the list or by using the search feature to view individual class analytics

5. Select the arrow next to "Classes" then select "Users" to view user analytics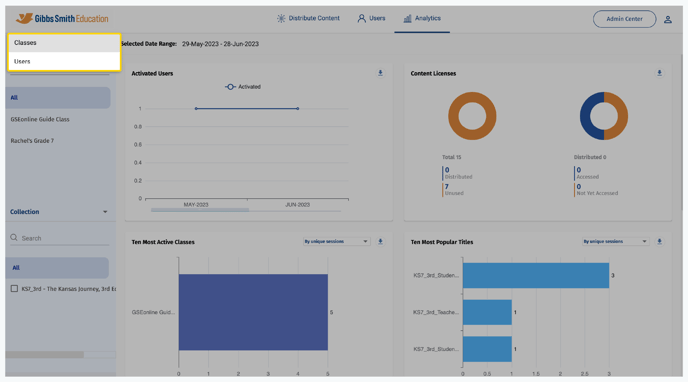
6. Click the filter dropdown and select a filter to display data by unique sessions or by minutes spent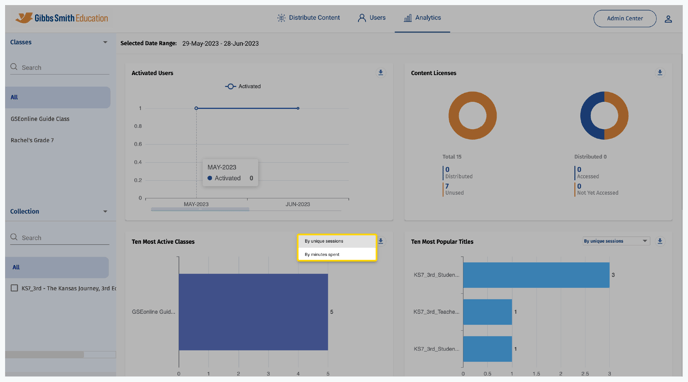
7. Click a "Download" icon to download data from a section as an Excel file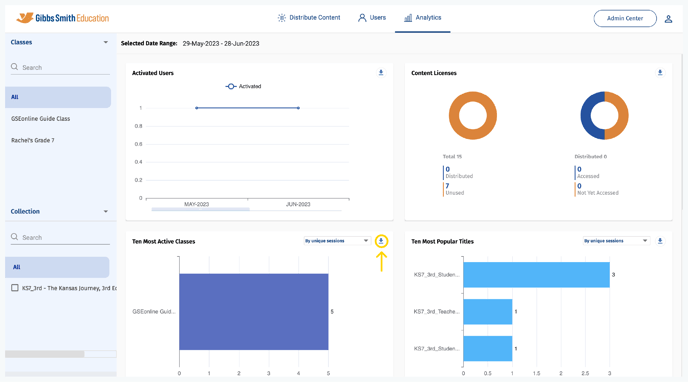
Analytics Descriptions
- Activated Users:The number of users activated for GSEonline.
- Content Licenses: The number of licenses distributed, accessed, unused (not yet distributed) and not yet accessed (distributed but not accessed).
- Ten most Active classes: The number of users who are assigned in classes and are actively accessing the collection and the more time spent on the collection. It shows the top 10 active classes.
- Data Sorting Options: By Unique Sessions or By Minutes Spent
- Ten most Popular Titles: The top 10 book which have been the most viewed or accessed.
- Data Sorting Options: By Unique Sessions or By Minutes Spent
- Content Coverage: Time spent reading content. Data is displayed By Minutes Spent.
- User Interaction: User interaction with Notes, Highlights, Bookmark, and Resources.
- Web Player: Usage By Format: Which devices users are using and also the most commonly used browsers.
Having trouble? Try enabling pop-ups and clearing cache and cookies.